Plot MrSGUIDE regression tree
plotTree(
  mrsobj,
  digits = 3,
  height = "600px",
  width = "100%",
  nodefontSize = 16,
  edgefontSize = 14,
  minNodeSize = 15,
  maxNodeSize = 30,
  nodeFixed = FALSE,
  edgeColor = "#8181F7",
  highlightNearest = list(enabled = TRUE, degree = list(from = 50000, to = 0), hover =
    FALSE, algorithm = "hierarchical"),
  collapse = list(enabled = FALSE, fit = TRUE, resetHighlight = TRUE, clusterOptions =
    list(fixed = TRUE, physics = FALSE)),
  alphaInd = 3
)
Arguments
| mrsobj | MrSGUIDE object |
|---|---|
| digits | digits for split threshold |
| height | figure height |
| width | figure width |
| nodefontSize | node font size |
| edgefontSize | edge font size |
| minNodeSize | minimal node size |
| maxNodeSize | maximum node size |
| nodeFixed | whether you can drag node |
| edgeColor | edge color |
| highlightNearest | choose node will highlight nearby |
| collapse | list, collapse or not using double click on a node |
| alphaInd | 1 is original alpha, 2 is individual level alpha, 3 is overall alpha |
Value
A list contains plot figure
The tree plot uses visNetwork function.
A data frame contain each elements used for tree plot.
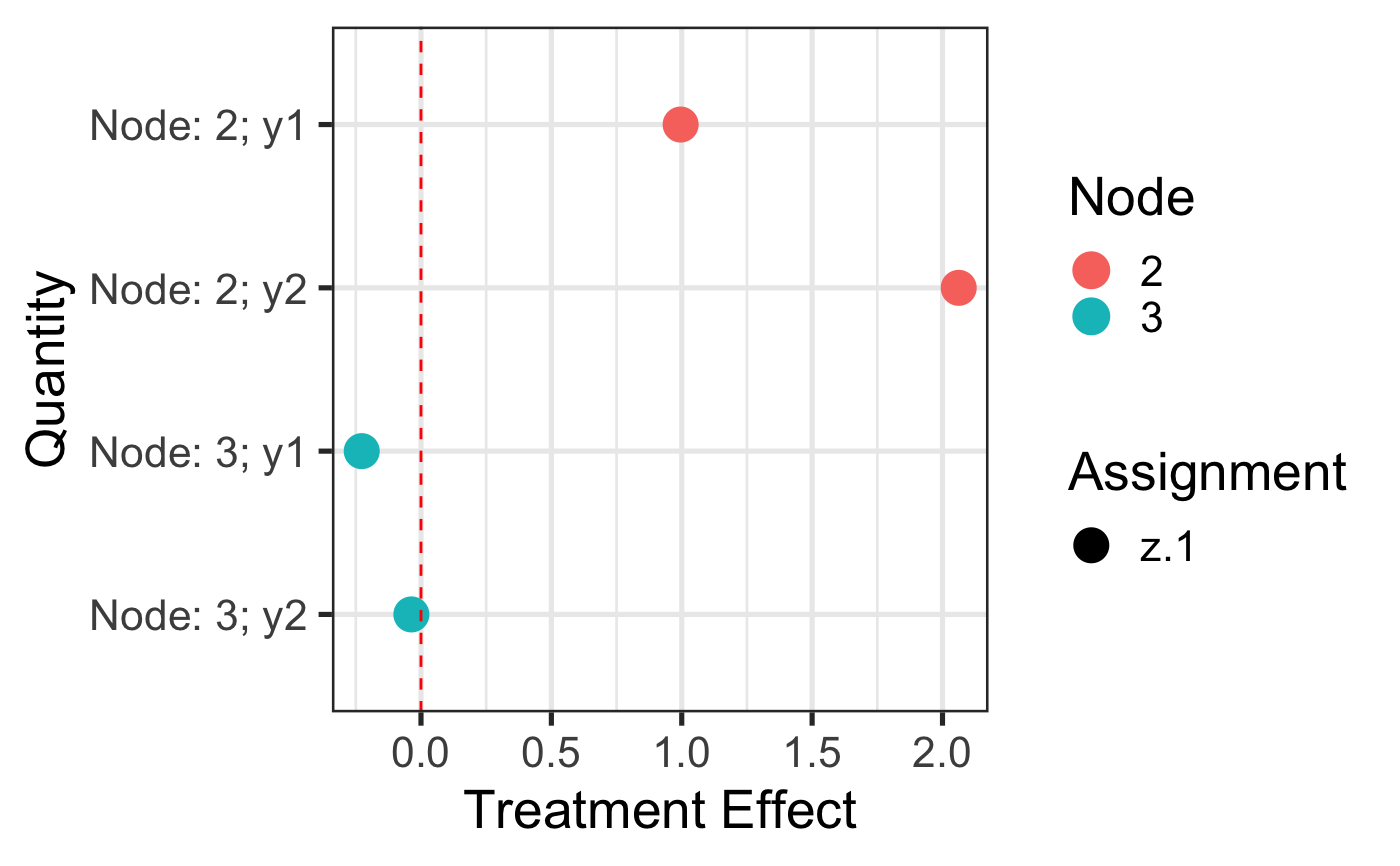
A treatment effects plot of each node.
Examples
library(MrSGUIDE)
set.seed(1234)

N = 200
np = 3

numX <- matrix(rnorm(N * np), N, np) ## numerical features
gender <- sample(c('Male', 'Female'), N, replace = TRUE)
country <- sample(c('US', 'UK', 'China', 'Japan'), N, replace = TRUE)

z <- sample(c(0, 1), N, replace = TRUE) # Binary treatment assignment

y1 <- numX[, 1] + 1 * z * (gender == 'Female') + rnorm(N)
y2 <- numX[, 2] + 2 * z * (gender == 'Female') + rnorm(N)

train <- data.frame(numX, gender, country, z, y1, y2)
role <- c(rep('n', 3), 'c', 'c', 'r', 'd', 'd')

mrsobj <- MrSFit(dataframe = train, role = role)
plotObj <- plotTree(mrsobj)
#plotObj$treePlot
plotObj$nodeTreat ## node information#>      Estimate       SE Assignment Outcome Node    Quantity       ymin      ymax
#> 2    0.995726 0.189337        z.1      y1    2 Node: 2; y1  0.6246255 1.3668265
#> 21   2.062110 0.180745        z.1      y2    2 Node: 2; y2  1.7078498 2.4163702
#> 22  -0.227258 0.200356        z.1      y1    3 Node: 3; y1 -0.6199558 0.1654398
#> 211 -0.036876 0.208765        z.1      y2    3 Node: 3; y2 -0.4460554 0.3723034
#>     zalpha
#> 2     1.96
#> 21    1.96
#> 22    1.96
#> 211   1.96plotObj$trtPlot ## treatment effect plot